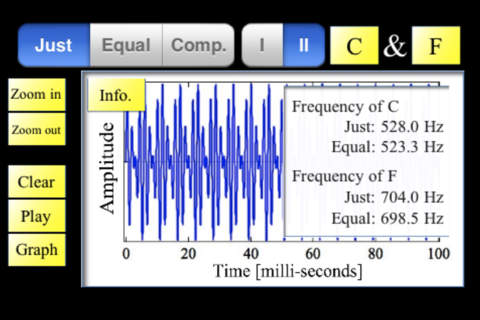
When you study theory of music, you will learn that C and F make beautiful harmony, while C and F# make disharmony.
For the better understanding of these facts, This application will visualize sounds.
In this application, the sounds is displayed in a graph having transverse and longitudinal axis, representing time and intensity, respectively.
You can easily see that the graph of harmony is very clear, but the graph of disharmony is messy.
Do you know there are mainly two kinds of intonations?
One is just intonation and another is equal intonation.
Just intonation can make a perfect harmony, though it is difficult to modulate.
Equal intonation is different from just intonation, thus the harmony is not ideal, though we can modulate the sounds.
This application display difference between just and equal intonations in a graph, and also make sound of heave between just and equal intonations.
How to hear and see the harmony of C and F
1. Launch the application.
2. Touch "start button".
3. Touch "II" button.
4. Touch keys of "C" and "F" (You can hear the harmony of C and F).
5. Touch "Graph" button (You can see the graph of the harmony of C and F).
6. Touch "Just" and "Equal" button to see and hear the difference in these two intonations.
7. Change the scale of transverse axis by touching "Zoom in" and "Zoom out" button to expand and shrink the time scale of the graph.
8. Touch "Info." button to show the difference of frequencies of just and equal intonations.
I hope this application will help your better understanding of sound and music.


